View Report(s)
.png)
Figure 2.7.1: The View Report(s) page
The View Report(s) page allows the user to view the reports created by the wizard. This section will only deal with how to interact with the reports, the reports themselves will be discussed in a separate section.
At the top of the page is the Selected Report drop down menu. This menu can only be accessed when both a heating and cooling design day have been created by the wizard as it controls which report is currently being viewed. Choosing the other report in the drop down menu will make that report the viewed report.
Underneath the drop down menu is a report viewer. On the left hand side of the report viewer is a document map, which has bookmarked specific areas of each report, allowing for quick access. The document map can be hidden by clicking on the document map icon on the far left of the report viewer toolbar. Different pages of the report can be accessed by clicking on the blue arrows in the top left corner of the report viewer as well.
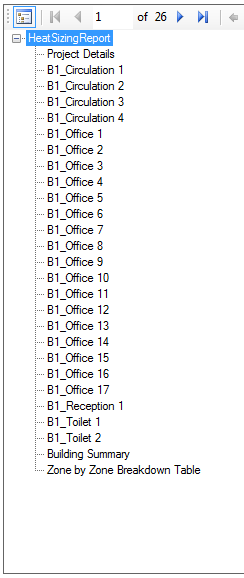
Figure 2.7.2: The document map with the document map icon in the top left corner.
The reports can be saved to a PDF or spreadsheet file. This can be done by clicking on the save icon or by right clicking on the report and then choosing the Export option on the contextual menu.
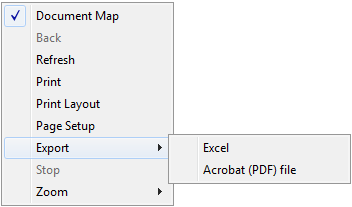
Figure 2.7.3: The contextual menu showing the export options for the reports.
Please note that with large models exporting a report to a pdf file will take a lot longer than exporting a report to Excel.