Using CBDM to improve daylight quality in my classroom design.
Climate Based Daylight Modelling (CBDM) has been around for a while now and it’s often a requirement that it’s carried out on buildings, particularly schools, to test the quality of the daylight that can be expected within the occupied spaces to help reduce electrical lighting energy and improve occupant well-being. Rather than simply taking a design, carrying out the CBDM assessment on it and tweaking the internal surface reflectance values and/or glazing transmission to achieve a “passing” result let’s look at using CBDM as an iterative design tool to find a daylight solution that provides desired results for our classroom. Starting with a very basic design let’s look at how we can alter this, investigate the effects on the daylight availability and compare the results obtained from 6 different classroom designs.
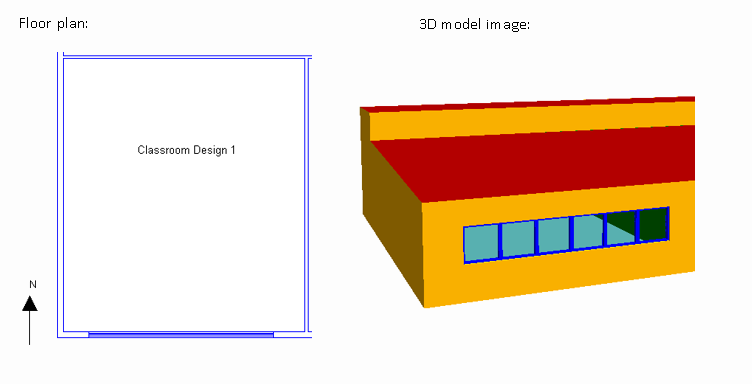
To start with a simple strip of six 1m x 1m windows was modelled along the façade for our fairly deep south facing classroom with a floor area of 70m2 as shown in the images below.
The CBDM report produces results in the form of Useful Daylight Illuminance (UDI) metrics which are as follows:
- UDIs – ‘Supplementary’ – Annual occurrence of illuminances less than the acceptable lux level.
- UDIa – ‘Acceptable’ – Annual occurrence of illuminances between the acceptable lux level and the excessive lux level.
- UDIt – ‘Target’ – Annual occurrence of illuminances between the target lux level and the excessive lux level.
- UDIe – ‘Excessive’ – Annual occurrence of illuminances greater than the excessive lux level.
UDIs corresponds to time where electric lighting will be required in the space. UDIa corresponds to time where the daylight is acceptable and electric lighting isn’t required. UDIt corresponds to time where the desired target illuminance is met by daylight. UDIe corresponds to time where the daylight is excessive and may be too bright for occupants.
For this project the acceptable lux level was set to 100 lux, the target lux level was set to 300 lux and the excessive lux level was set to 3000 lux. These values may well change between projects and are set by the user in the CBDM tool before the calculation is carried out. The weather file used in this project was the 2005 CIBSE London TRY.
The CBDM report also produces results for the Spatial Daylight Autonomy (sDA); this is the percentage of area that is above a specified lux level for a specified percentage of the time or more (t/50% corresponds to the target illuminance for 50% of the occupied time) and the UDIa Min; this is the minimum result for the grid point with the lowest average UDIa result and so is useful in investigating the uniformity of the average UDIa result.
Classroom Design 1 Results:
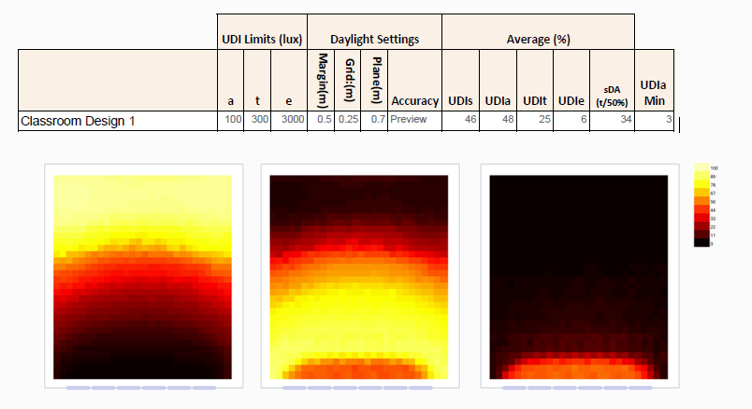
Floor plans showing the average UDIs, UDIa and UDIe from left to right. As the UDIs reports areas that have lux levels below the acceptable level the light parts of the image correspond to areas that are not getting sufficient light and vise versa.
The average UDIt result of 25% from this assessment shows that the majority of the space is not achieving the target illuminance level of 300 lux for a significant portion of time, looking at the floor plans above it’s evident that not enough space is reaching the back of the classroom and you can also see a small patch by the windows that is occasionally getting too much daylight in the average UDIe floor plan on the right. The average UDIa floor plan in the middle shows a band around the middle of the classroom that is only achieving an acceptable lux level between 33-67% of the time.
One option to allow more daylight into the back and middle of the classroom is to increase the height of the windows, allowing a larger amount of daylight to enter the space and increasing the angle at which it can penetrate into the space. To investigate this the window heights were increased to 2m for design 2.
Classroom Design 2 Results:
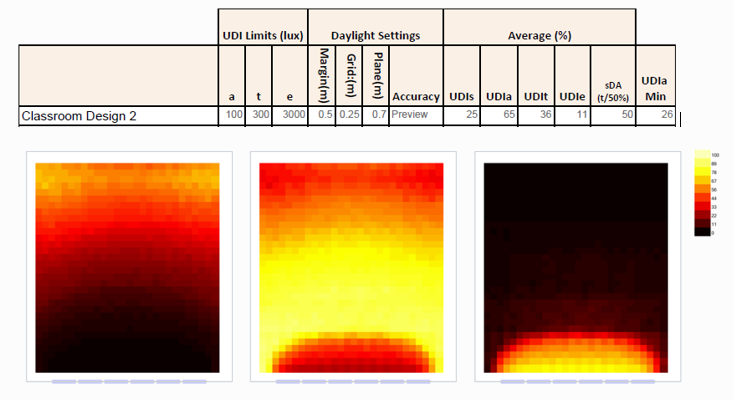
Floor plans showing the average UDIs, UDIa and UDIe from left to right. As the UDIs reports areas that have lux levels below the acceptable level the light parts of the image correspond to areas that are not getting sufficient light and vise versa.
The change in window height resulted in an increased average UDIt and UDIa results of 36% and 65% respectively, this means that the space now achieves its target illuminance level and its acceptable illuminance level more often than in design 1. The average UDIe result has also increased to 11% however, this means that the excessive lighting level of 3000 Lux is now being reached more than before and there is an increased risk of glare and occupant discomfort.
If we look at the Minimum UDIa we can see that this is quite low when compared to the average UDIa, this signals that there are still areas in the space that are not achieving sufficient daylight and that the distribution of the light within the space could be improved upon. Inspecting the floor plans we can see we are still not achieving the desired daylight at the back of the classroom and the front of the classroom is often receiving excessive daylight levels.
To attempt to reduce the excessive daylight in the space an external shade system consisting of 6 fins at an angle of 165° was added in front of the south facing windows in the Tas 3D model, a screenshot of the 3D model showing the shades can be found below. An angle of 165° was chosen as this would block more daylight from entering the front of the classroom (where we are experiencing excessive lux levels) when the sun is positioned high in the sky, whilst still allowing light to penetrate into the back of the space when the sun is at a lower angle.
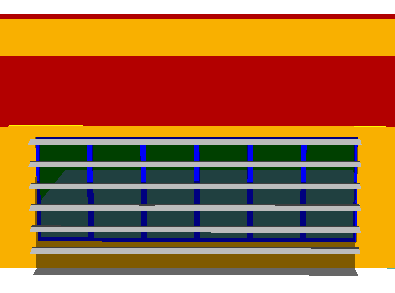
3D image from model showing shades included.
Classroom Design 3 Results:
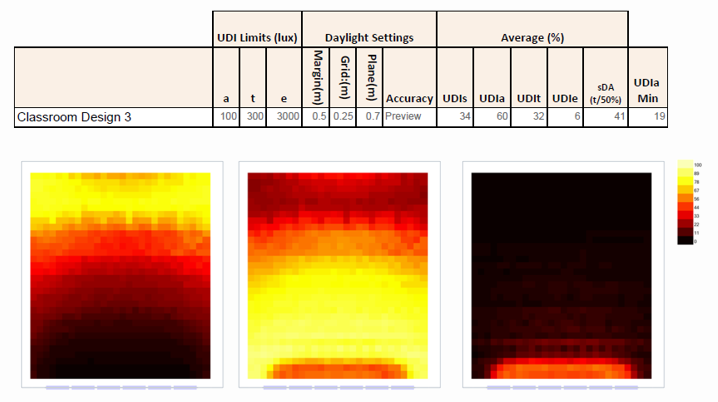
Floor plans showing the average UDIs, UDIa and UDIe from left to right. As the UDIs reports areas that have lux levels below the acceptable level the light parts of the image correspond to areas that are not getting sufficient light and vise versa.
Introducing the shade reduced the average UDIe to 6%, it did however also reduce the average UDIa and UDIt results in doing so. Looking at the reduced UDIe figure and the UDIe floor plan informs us that the shade is successful in reducing daylight in the desired area of the classroom. If the UDIe had not come down this would inform us that the shade is not reducing the light entering the space at the times when excessive light levels are reached and that we need to look at refining its design, possibly by adding fins or adjusting the angle of the fins.
If the shade was not effective at reducing the average UDIe result we could use the CBDM results viewer to see at what time of the year the different parts of the space are too bright or dark, then use the display sun option in conjunction with shadows displayed to position the sun at the right location for that hour in the year and make an intelligent estimate for what sort of shade angle would rectify the problem we are trying to solve.
Our next step is to address the lack of daylight at the back of the classroom, one option to do this would be to add rooflights directly to the space, another possibility is to add windows into the top of the corridor and internal windows from the corridor to the classroom so that light can be shared between the corridor and the back of the classroom. To compare these two strategies the side-lit windows were reverted to the 1m tall windows and the external shades were removed so that the effect on the daylight levels reached at the back of the classroom by could be investigated. Both design options were run on identical classrooms at the same time to investigate which would be more appropriate.
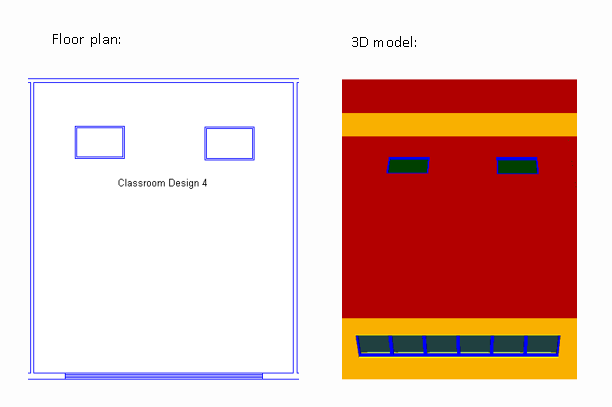
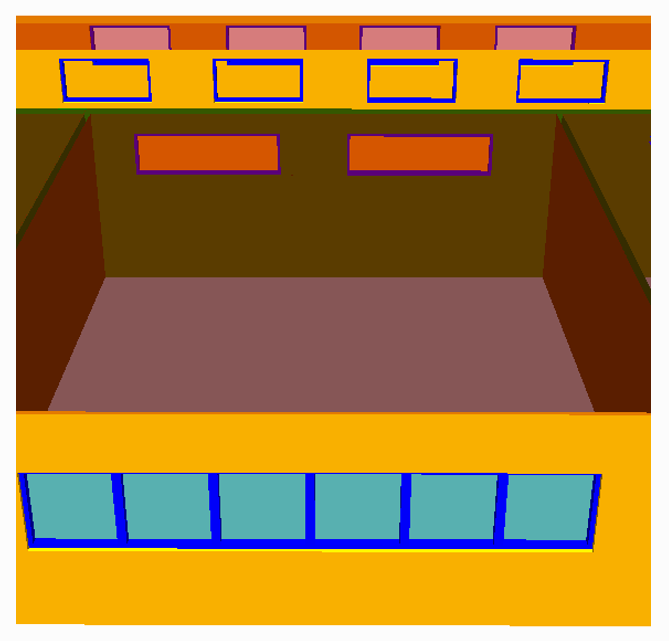
Classroom design 4 includes two rooflights each 1.5m x 1m as shown in the model images below:
Classroom 5 includes high level windows into the corridor and internal windows between the corridor and classroom as shown in the 3D model image below:
*The roof constructions have been displayed as transparent to show the internal windows.
Classroom Design 4 & Classroom Design 5 Results:
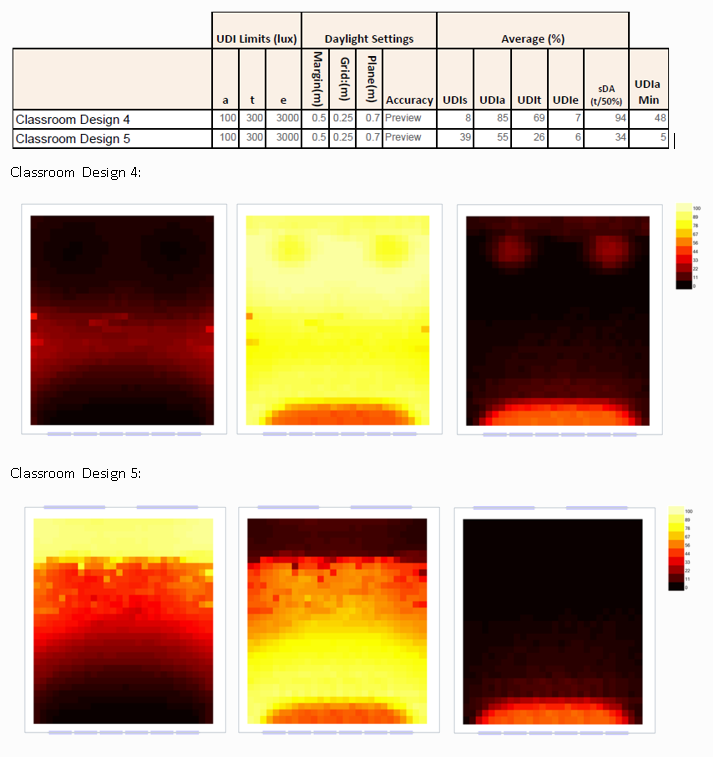
Floor plans showing the average UDIs, UDIa and UDIe from left to right. As the UDIs reports areas that have lux levels below the acceptable level the light parts of the image correspond to areas that are not getting sufficient light and vise versa.
From the results it is clear that the rooflights are much more effective at introducing light into the back of the classroom with an average UDIa of 85% we know that the light in the space will be at acceptable levels without the use of additional lighting for a large portion of the year.
The floor plans clearly show the difference in the light distribution between the two methods if using shared light from the corridor was the desired approach the design would have to be refined, perhaps high level corridor windows aren’t sufficient or the internal windows need a larger area for the back of the classroom to receive sufficient light.
I was interested to see how the rooflights would perform in combination with the 2m tall windows and external shade system so this was set up as Classroom Design 6.
Classroom Design 6 Results:
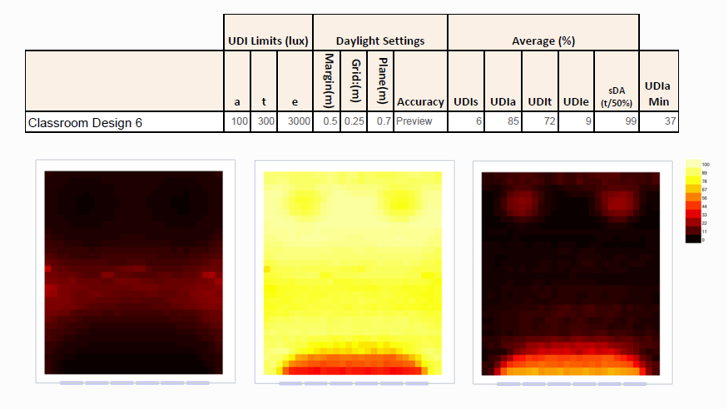
Floor plans showing the average UDIs, UDIa and UDIe from left to right. As the UDIs reports areas that have lux levels below the acceptable level the light parts of the image correspond to areas that are not getting sufficient light and vise versa.
This provides the highest average UDIa and average UDIt of all of the design options modelled so far but the UDIe has also crept back up to 9%. It has to be considered if the small increase in average UDIa and average UDIt are worth the cost of installing the larger windows and shade system in addition to the increased risk of excess lighting. If it was decided that this is the desired design solution but the average UDIe of 9% was a concern then we could look at adjusting the external shade to further reduce excess light at the front of the classroom or add internal blinds onto the rooflights, these 2 options would address the areas of the classroom that are effected by excess daylight that can be seen in the floor plan on the right.
To summarize let’s look at all of the results together.
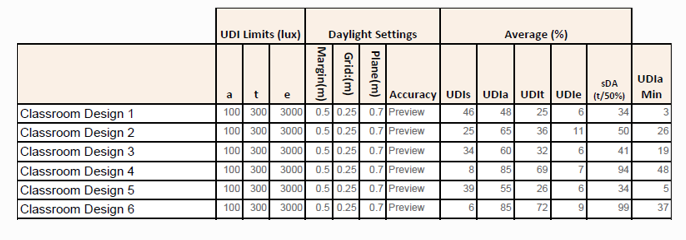
The initial design including 6 1m x 1m windows did not achieve acceptable daylight levels for a large proportion of the year, changing the height of the windows to 2min design 2 increased the acceptable daylight levels in the classroom but it also meant that excessive daylight levels were experienced more often near the windows. The shade that was added in design 3 reduced the excessive daylight along the south facing side of the classroom but also reduced the average UDIa and UDIt results we were trying to improve. Designs 4 and 5 were two options aimed at increasing the amount of daylight in the back of the classroom, design 4 utilized rooflights and design 5 aimed to share light with the corridor via high level windows. For designs 4 and 5 the windows were reverted to 1m x 1m windows and the shade system was removed, the rooflights proved a better option for our classroom and greatly increased the amount of time the classroom reached acceptable light levels with daylight alone. For Design 6 the rooflights were combined with the 2m tall windows and shade system, this did further increase the useful daylight in the space albeit slightly but it also increased the risk of excessive daylight and glare.
Using Tas CBDM tools distributed calculations makes is easy to quickly asses the daylight results for a number of different design options and find one that suits the space in question, being able to investigate the average UDI floor plans for the space allows a designer to clearly see which areas of the space are receiving the desired daylight and which areas could be improved on.
If you’re interested in carrying out CBDM assessments but don’t have a Tas licence you can contact us for a free trial of the software and learn how to carry them out or contact our consultancy department who can assist in carrying the assessment out on your building design.