1. Introduction
The Design Day Wizard has been added to Tas v9.4 to simplify the process of creating steady state heating design days and cyclic cooling design days. The following guide will talk about how to use the Design Day Wizard to setup the design days and how to view the reports it creates.
1.1 Before Using the Design Day Wizard
Before using the Design Day Wizard you will need to create the building geometry in Tas 3D Modeller (T3D) and export this data to Tas Building Simulator (TBD). Within TBD, constructions must be applied to all applicable building elements, while the appropriate weather file must be selected (if the weather file changes location, then redo any shading calculations).
If you are planning on setting up a cooling design day, then you will need to create internal conditions specifying the gains and thermostat to be used on the design calculation. These internal conditions can be created by using the IC Generation Tool or by using the Internal Conditions Database. The NCM internal conditions, intended for use with the UK Building Regulations only, should not be used in conjunction with the Design Day Wizard.
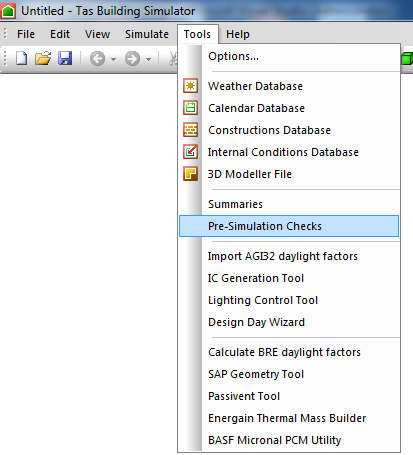
Before opening up the Design Day Wizard, the Pre-Simulation Checks found within TBD should be run to check for any potential issues. These checks can be found by selecting Tools → Pre-Simulation Checks on the menu bar. EDSL recommends that any errors and warnings that are found are corrected before running the Design Day Wizard on this file.
1.2 Where in Tas Can I Find the Design Day Wizard?
The Design Day Wizard can only be accessed from within TBD. It can be found on the menu bar by going to Tools → Design Day Wizard.
2 The Wizard
2.1 Select Design Day Type
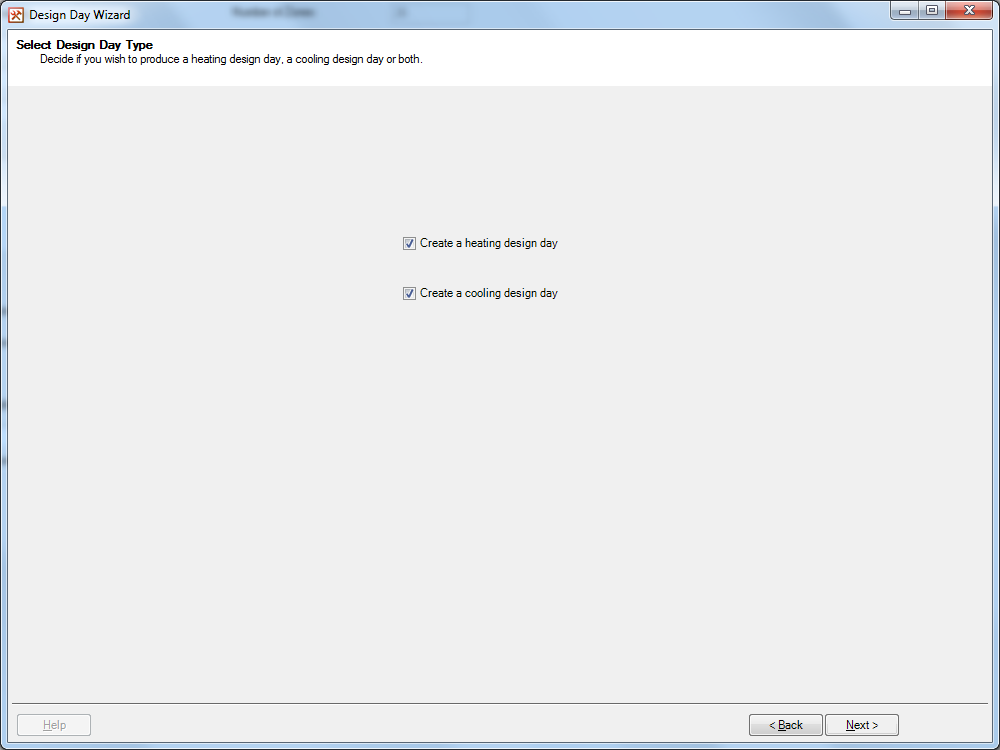
On the Select Design Day Type page, there are two checkboxes which decide which design days will be created:
- Create a Heating Design Day – When this option is ticked, the wizard will provide options to setup a steady state heating design day.
- Create a Cooling Design Day – When this option is ticked, the wizard will provide options to setup a cyclic cooling design day.
At least one of these two checkboxes must be ticked before moving onto the next page of the wizard. If both options are selected, then the wizard will proceed in creating both the heating and cooling design days.
2.2 Setup Zones for the Heating Design Day
The Setup Zones for the Heating Design Day page will only appear if the user checked the Create a Heating Design Day option on the Select Design Day Type page. This page is used to setup the conditions for the steady state calculation.
The majority of the page is taken up by two tree views. The one on the left, called Available Zones, lists all zones in the TBD file (except external zones) that have not currently been setup. The tree view on the right, called Zones to be Sized, lists all zones that will be sized on the steady state calculation. Zones can be dragged across from one tree view to the other, as seen in Video 2.
When setting up a steady state calculation the zone’s: design dry bulb temperature, infiltration rate, ventilation rate, size factor and radiant proportion of the heating emitter all need to be provided. These are set using the values in the Zone Selection box. When you drag a zone onto the Zones to be Sized tree view, the currently entered values in this box are applied to the zone. The data can also be changed by selecting the zones in the tree view, amending the data in the Zone Selection Box and pressing the Set button.
The fields in the Zone Selection box are:
- Zone Temperature – This field sets the design dry bulb temperature for the zone. This can be set in °C or °F, depending on the unit system Tas is using.
- Infiltration – This field sets the infiltration rate for the zone. The unit used is air changes per hour. Please note that the infiltration rate cannot be negative.
- Ventilation – This field sets the ventilation rate for the zone. The unit used is air changes per hour. Please note that the ventilation rate cannot be negative.
- Size Factor – The Size Factor field allows you to over size your heating emitters in the zone. The user would enter the margin as a factor, so to account for a 10% margin you would enter 1.1 into the size factor field.
- Emitter Type – The Emitter Type combo box allows the user to set the radiant proportion of their heating emitter using the typical radiant proportions provided in Table 5.10 of CIBSE Guide A 2015. The radiant proportion for these options is displayed in the Radiant Proportion field. If the user wishes, they can enter their own radiant proportion by selecting the User Defined option on the combo box and then entering their radiant proportion into the Radiant Proportion field.
Emitter Type Radiant Proportion Forced warm air heaters 0 Natural convectors and convector radiators 0.1 Multi-column radiators 0.2 Double and treble panel radiators, double column radiators 0.3 Single column radiators, floor warming systems, block storage heaters 0.5 Vertical and panel heaters 0.67 Ceiling panel heater 0.9 Heated floor 0.6 Table 1: Radiant Proportions from Table 5.10 of CIBSE Guide A 2015
In the External Drybulb Temperature box the user needs to enter the design external drybulb temperature they wish to be used during the steady state heating design day.
This can be entered in either °C or °F, depending on the unit system Tas is using.
There is also a zone filter, located above the two tree views, which allows the user to filter the zones shown in both of the tree views.
If the user wishes to account for any infiltration or ventilation in unheated spaces, they will need to add the applicable zones to the Zones to be Sized tree view, but set the zone’s temperature to -50 °C (-58 °F).
2.3 Select Cooling Design Day Weather Source
The Select Cooling Design Day Weather Source page will only appear if the user checked the Create a Cooling Design Day option on the Select Design Day Type page.
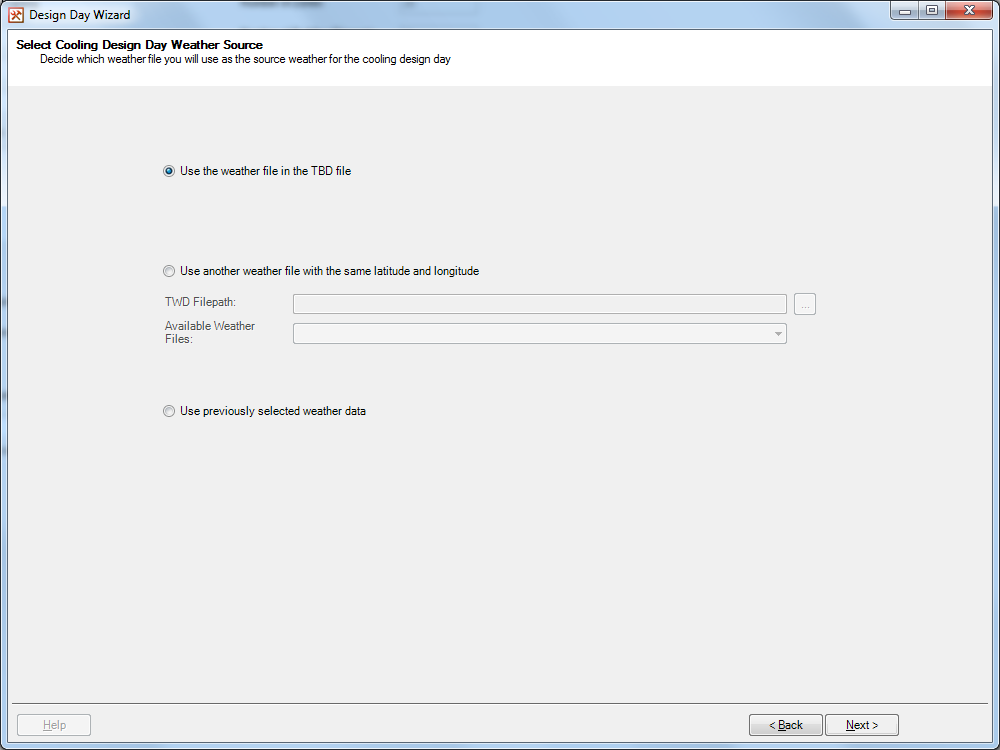
On this page the user will select the source of the weather data used on the cooling design day.
The three different options for the source weather file are:
- Use the weather file in the TBD file – When this option is selected, the wizard will obtain the five hottest days from the weather data in the TBD file and allow you to choose one of these days as the basis for the cooling design day weather.
- Use another weather file with the same latitude and longitude – When this option is selected, the user will be required to select a weather database file for the wizard to use. When an appropriate database is provided, the wizard will list all weather files with the same latitude and longitude as the current weather file in the TBD file. Upon choosing one of these weather files, the wizard will obtain the five hottest days from that weather file and allow you to choose one of these days as the basis for the cooling design day weather.
- Use previously selected weather data – When the Design Day Wizard is first run on a file this option will not be available. This option is only available once the wizard is re-run and allows the user to use the weather data they setup previously for the cooling design day.
Please note that the selection of the day is not done on this page but the Setup Weather Data page.
2.4 Setup Weather Data
The Setup Weather page will only appear if the user checked the Create a Cooling Design Day option on the Select Design Day Type page. On this page the user will setup the weather data used on the cyclic cooling design day.
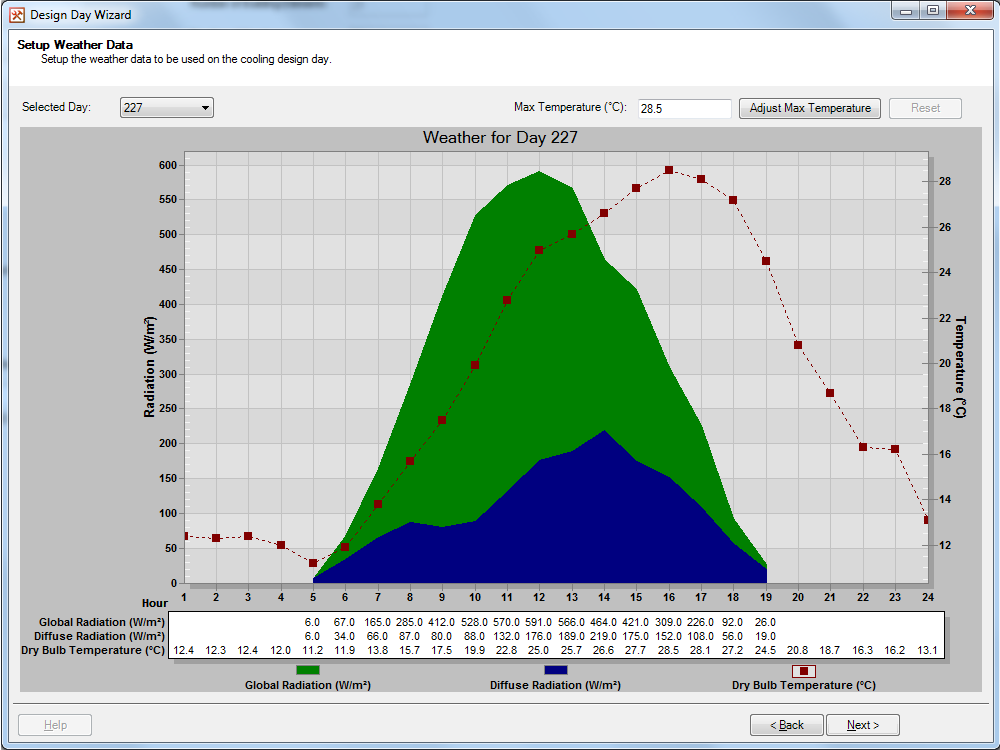
In the top left corner of the page, there is a Selected Day combo box. There are five options available in the combo box, and these are the 5 hottest days (determined by peak temperature) from the selected weather data on the Select Cooling Design Day Weather Source page. The data for the selected day appears in the graph and table below the combo box.
On the graph: the green area plot relates to the global radiation values in the weather file, the blue area plot relates to the diffuse radiation values in the weather file and the red line graph relates to the external dry bulb temperature in the weather file. The global and diffuse radiation plots use the axis on the left hand side of the screen, while the temperature plot uses the axis on the right hand side of the screen.
Underneath the graph there is a table detailing the global radiation, diffuse radiation and external dry bulb temperature at each hour of the day. The graph and table will display in either SI metric or US customary units depending on which unit system Tas is currently using.
In the top right corner there is a field displaying the current peak temperature from the selected day. If the user wishes, they could enter a new peak into this field. Once the Adjust Maximum Temperature button is pressed, the temperature at each hour is shifted by the difference between the user’s entered max temperature and the existing one. I.e. if the new max was 32 °C and the existing one was 28.5 °C, then 3.5 °C would be added to the temperature in each hour. The change in temperatures will be reflected in the graph (the axis will change) and in the table.
Please note that when the weather data is amended using the Adjust Maximum Temperature field, or when the Use Previously Selected Weather Data option was selected on the Select Cooling Design Day Weather Source page, the combo box will be disabled and greyed out. To be able to switch to a different day after using the Adjust Maximum Temperature field, the user will need to press the reset button. To change weather after selecting Use Previously Selected Weather Data, the user will need to return to the Select Cooling Design Day Weather Source page and choose one of the other options.
2.5 Setup Zones for the Cooling Design Day
The Setup Zones for the Cooling Design Day page will only appear if the user checked the Create a Cooling Design Day option on the Select Design Day Type page. This page is used to assign the already created internal conditions in the TBD file to the zones on the cooling design day.
The majority of the page is taken up by two tree views. The one on the left, called Available Zones, lists all zones in the TBD file (except external zones) that have not currently been setup. The tree view on the right, called Zones to be Sized, lists all zones that will be sized on the cyclic calculation. Zones can be dragged across from one tree view to the other, as seen in video 3.
When a zone is added to the Zones to be Sized tree view, or when a zone is highlighted in the Zones to be Sized tree view and the Set button is pressed, an internal condition is assigned to it and a size factor is set. Which internal condition is applied depends on the option selected in the Zone Selection box. The two available options are:
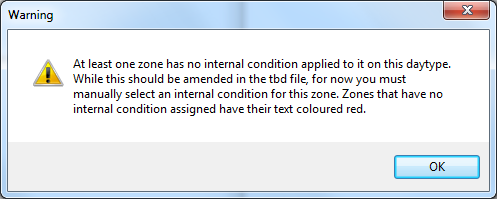
- Assign internal conditions to zones using an existing day type – When this option is selected, the user is required to select a day type from the calendar in TBD from the Selected Day type drop down menu. When assigning the internal condition to the zone, the wizard will look at the internal condition assigned to the zone on that day type and apply it on that zone for the cooling design day calculation. Please note that if there is no internal condition assigned to this day type for the zone, you will receive a warning and will not be able to progress from this page until an internal condition is assigned to the zone.
- Assign internal conditions to zones by internal condition – When this option is selected, the user is required to select an internal condition from the Selected Internal Condition dropdown menu. This selected internal condition will be the one assigned to the zones.
The size factor assigned to each zone is taken from the Size Factor field on the left hand side of the screen.
There is also a Zone Filter, located above the two tree views, which allows the user to filter the zones shown in both of the tree views.
2.6 Generation and Simulation
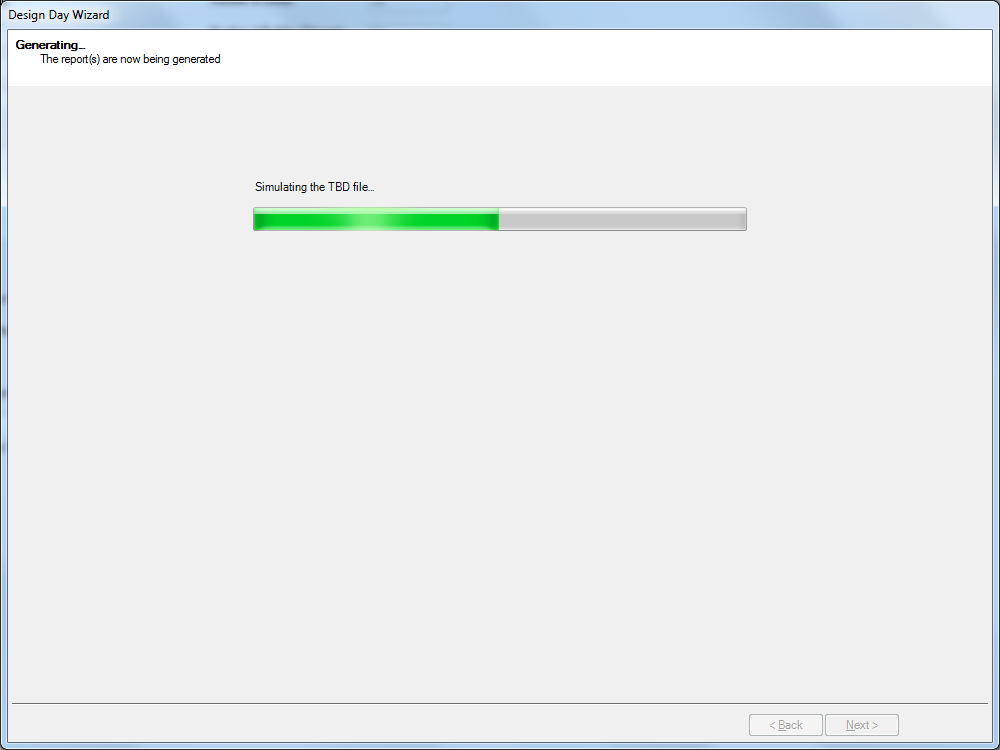
The Generating… page will keep the user informed on how far the wizard has got with generating the design day(s) and producing the report(s). There are three distinct sections during this process:
- Creating the design day(s) in the TBD file – The wizard will create the design day(s) using the data the user has entered.
- Simulating the TBD file – The wizard will then simulate the design day(s) in the TBD file. This section will often be the longest to complete.
- Creating the report(s) – Once the design day(s) have been simulated, report(s) will be produced based off the results of each simulation.
During the generation, the wizard will update both the progress bar and text above the progress bar to indicate how far it has progressed.
While the wizard is generating the design day(s) and producing the reports you will not be able to move away from this page.
Once the generation process is finished, and the report(s) have been created, the wizard will automatically move on to the next page.
2.7 View Report(s)
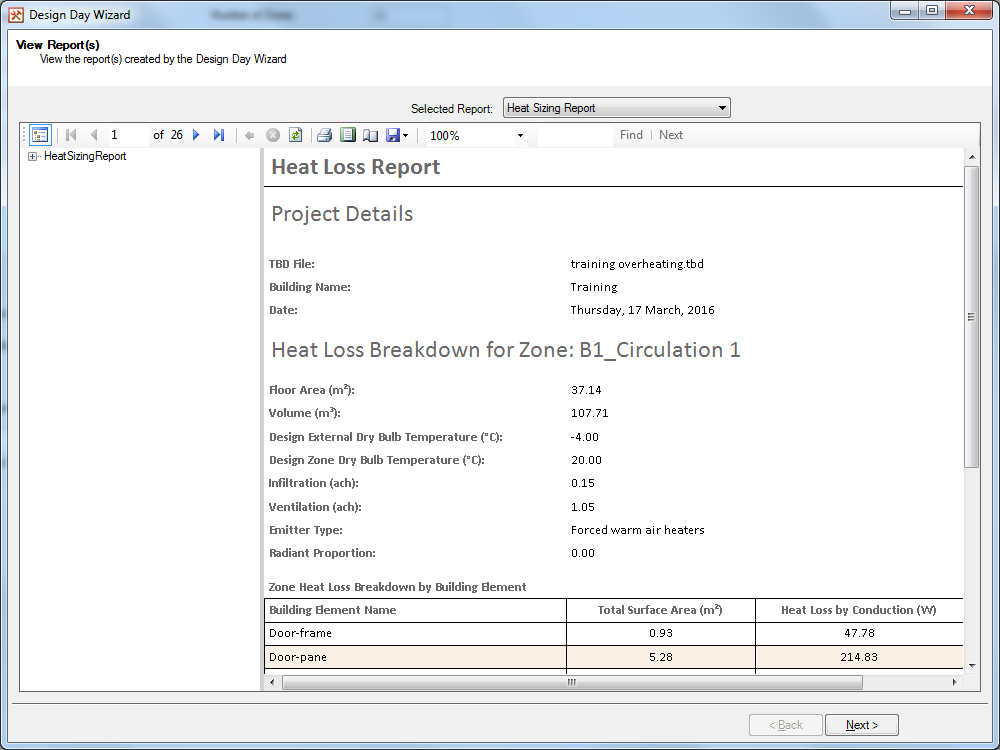
The View Report(s) page allows the user to view the reports created by the wizard. This section will only deal with how to interact with the reports, the reports themselves will be discussed in a separate section.
At the top of the page is the Selected Report drop down menu. This menu can only be accessed when both a heating and cooling design day have been created by the wizard as it controls which report is currently being viewed. Choosing the other report in the drop down menu will make that report the viewed report.
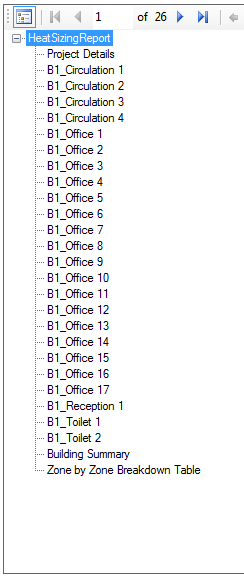
Underneath the drop down menu is a report viewer. On the left hand side of the report viewer is a document map, which has bookmarked specific areas of each report, allowing for quick access. The document map can be hidden by clicking on the document map icon on the far left of the report viewer toolbar. Different pages of the report can be accessed by clicking on the blue arrows in the top left corner of the report viewer as well.
The reports can be saved to a PDF or spreadsheet file. This can be done by clicking on the save icon or by right clicking on the report and then choosing the Export option on the contextual menu.
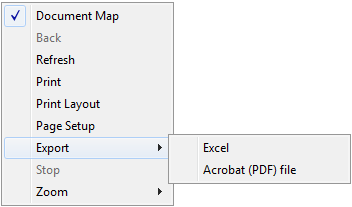
Please note that with large models exporting a report to a pdf file will take a lot longer than exporting a report to Excel.
3 The Reports
3.1 Heat Sizing Report
The Heat Sizing Report is produced when a heating design day has been created. The report has 4 distinct sections:
-
Project Details –
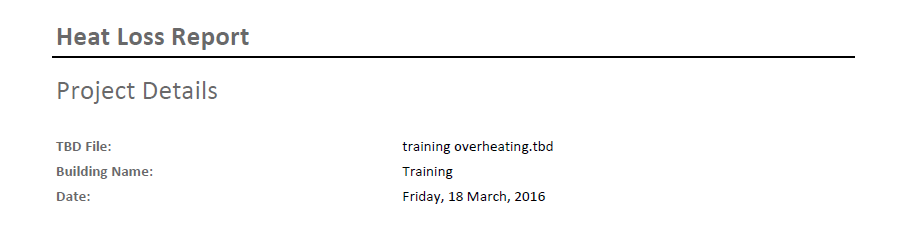
Figure 3.1.1: The Project Details section of the Heat Sizing Report. The Project Details section of the report provides some details on the report, including the name of the TBD file and the date the report was generated.
-
Heat Loss Breakdown –
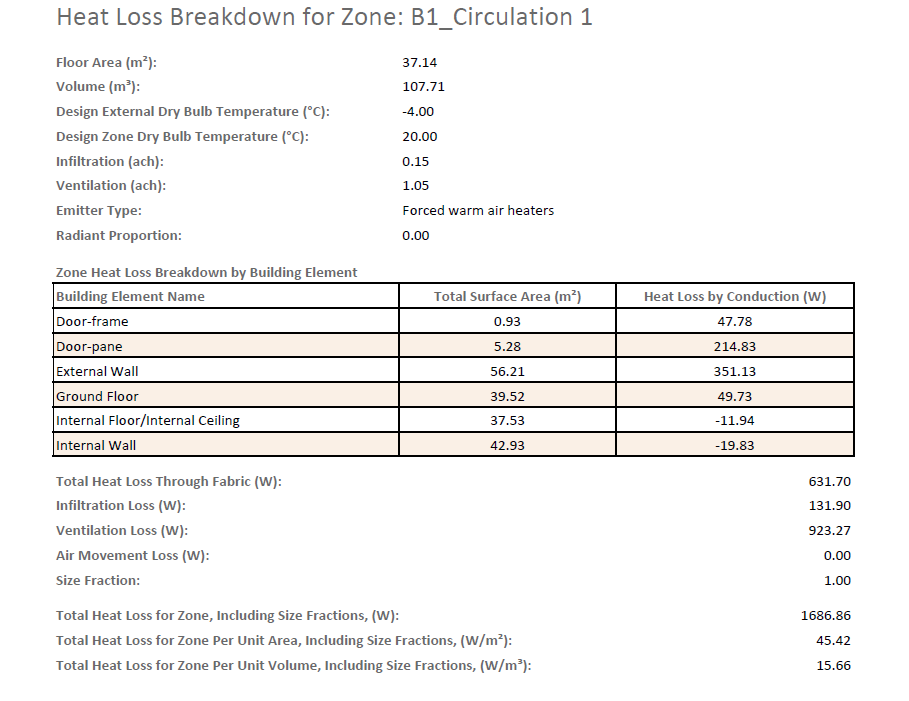
Figure 3.1.2: The Heat Loss Breakdown section of the Heat Sizing Report. The Heat Loss Breakdown section gives a breakdown, for each zone, of the heat losses within the zone. It starts off by stating some of the inputs entered into the wizard for the zone, along with the area and volume of the zone. Below that, a table lists the heat loss by conduction for each building element in the zone. Underneath the table, the total heat loss through the building elements is listed, along with the heat loss due to infiltration, ventilation and air movement. Finally the total heat loss for each zone is listed, taking into account of the size fraction applied to the zone.
-
Building Summary –
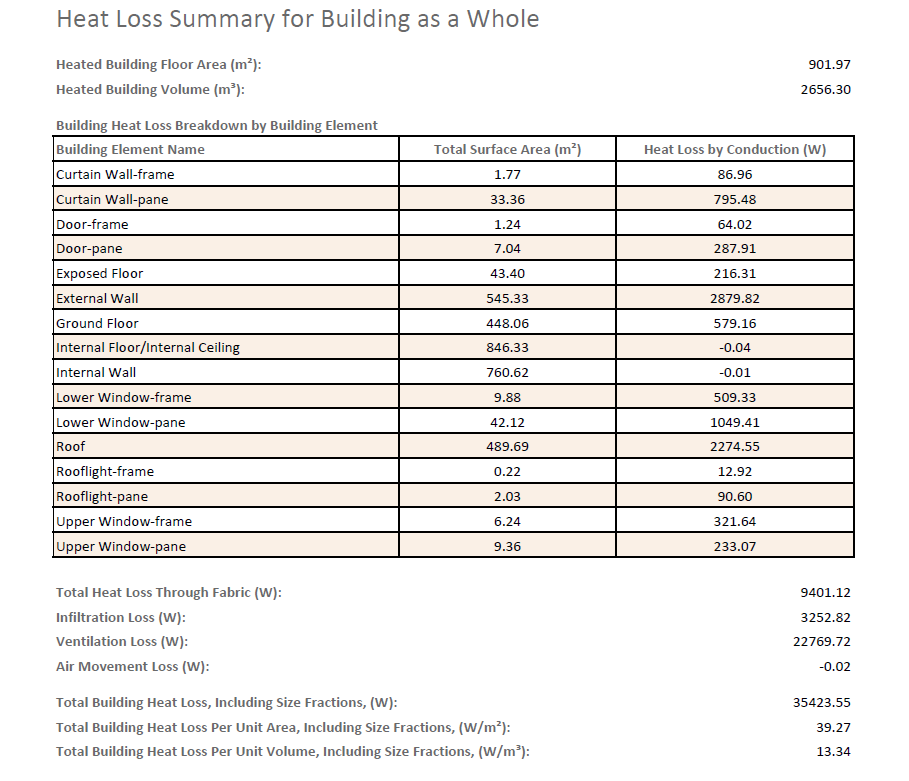
Figure 3.1.3: The Building Summary section of the Heat Sizing Report. The Building Summary section provides a breakdown of the heat losses for the building. At the top, it reports the total floor area and volume for all reported zones. Then, in the table, it reports the heat loss by conduction through each building element in the building. Underneath the table, the total heat loss through the building elements is listed, along with the heat loss due to infiltration, ventilation and air movement. Finally the total heat loss for the building is listed, taking into account of the size fraction applied to each zone.
-
Zone by Zone Breakdown Table –
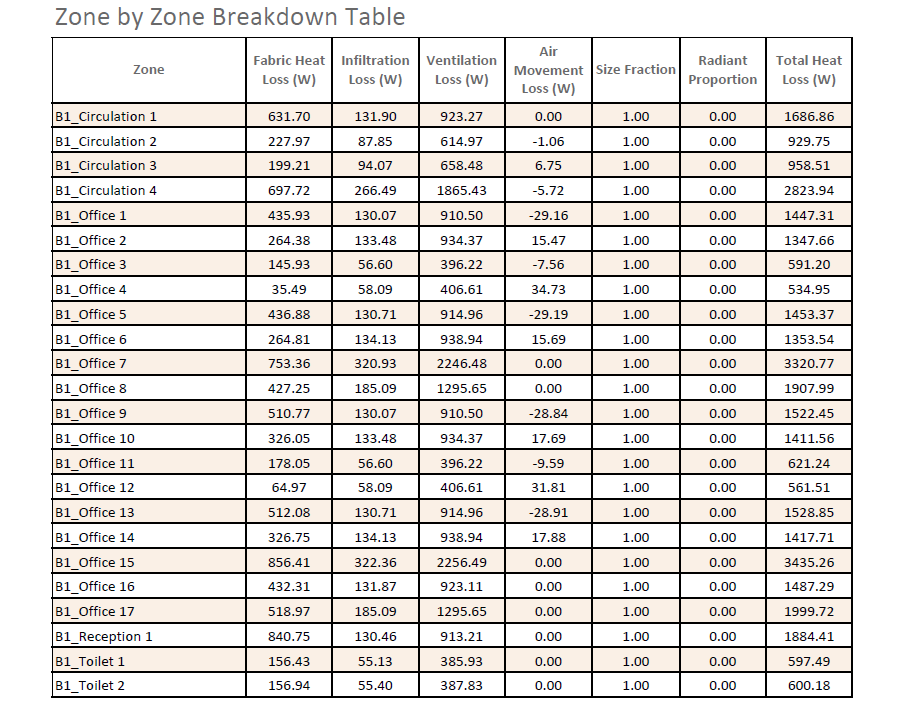
Figure 3.1.4: The Zone by Zone Breakdown Table on the Heat Sizing Report. The Zone by Zone Breakdown Table just summaries the: fabric losses, infiltration losses, ventilation losses, air movement losses, size fraction, radiant proportion and total heat loss for each zone.
3.2 Cooling Sizing Report
The Cooling Sizing Report is produced when a cooling design day has been created. The report has 5 distinct sections:
-
Project Details –

Figure 3.2.1: The Project Details section of the Cooling Sizing Report. The Project Details section of the report provides some details on the report, including the name of the TBD file and the date the report was generated.
-
Weather Data –
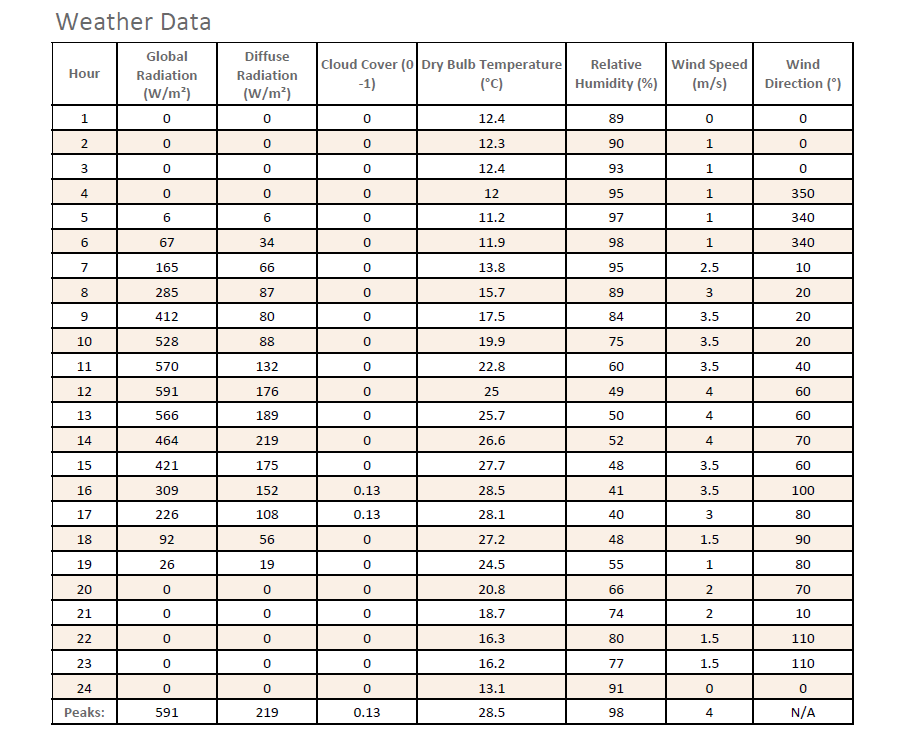
Figure 3.2.2: The Weather Data section of the Cooling Sizing Report. The Weather Data section reports the weather data used during the cooling design day in a tabular format. For each hour of the cyclic day the: global radiation, diffuse radiation, cloud cover, dry bulb temperature, relative humidity, wind speed and wind direction are reported, with the final row of the table reporting the peak value for each field. Please note that no peak is reported for the Wind Direction column as it is not applicable.
-
Zone Breakdown –
The Zone Breakdown section is the largest section of the report, as this section of the report is repeated for each zone. It starts of by listing the zone in question, along with its area and volume. After that, there is a table reporting the internal gains and thermostat used for that zone during the cooling design day calculation.
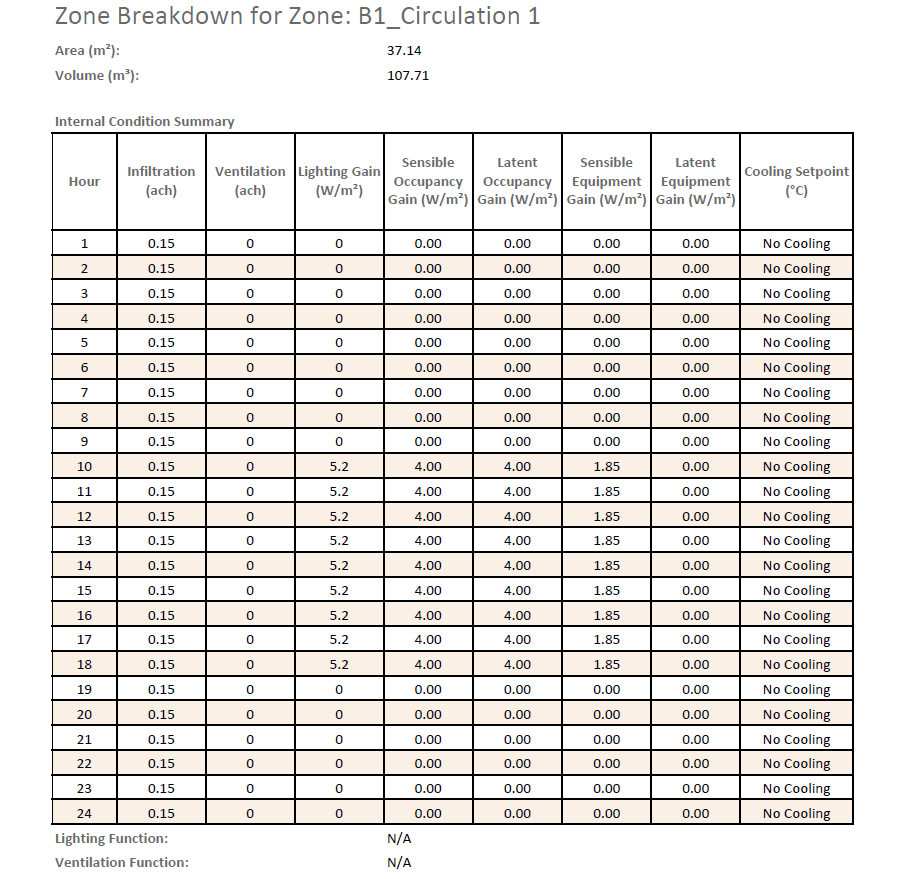
Figure 3.2.3: The first part of the Zone Breakdown section of the Cooling Sizing Report. The table has columns listing the: infiltration rate, ventilation rate, lighting gain, sensible occupancy gain, latent occupancy gain, sensible equipment gain, latent equipment gain and cooling setpoint for each hour of the cyclic day.
If a function is used in any hour for either the lighting gain or ventilation rate fields, the report will state the word “function” for that hour. The function string used will be reported under the table.
Below this, another table provides the sensible energy breakdown during the cooling design day. The table lists the: solar gain, lighting gain, infiltration and ventilation gain, air movement gain, building heat transfer gain, external conduction, sensible occupancy and equipment gains, and required sensible cooling load.
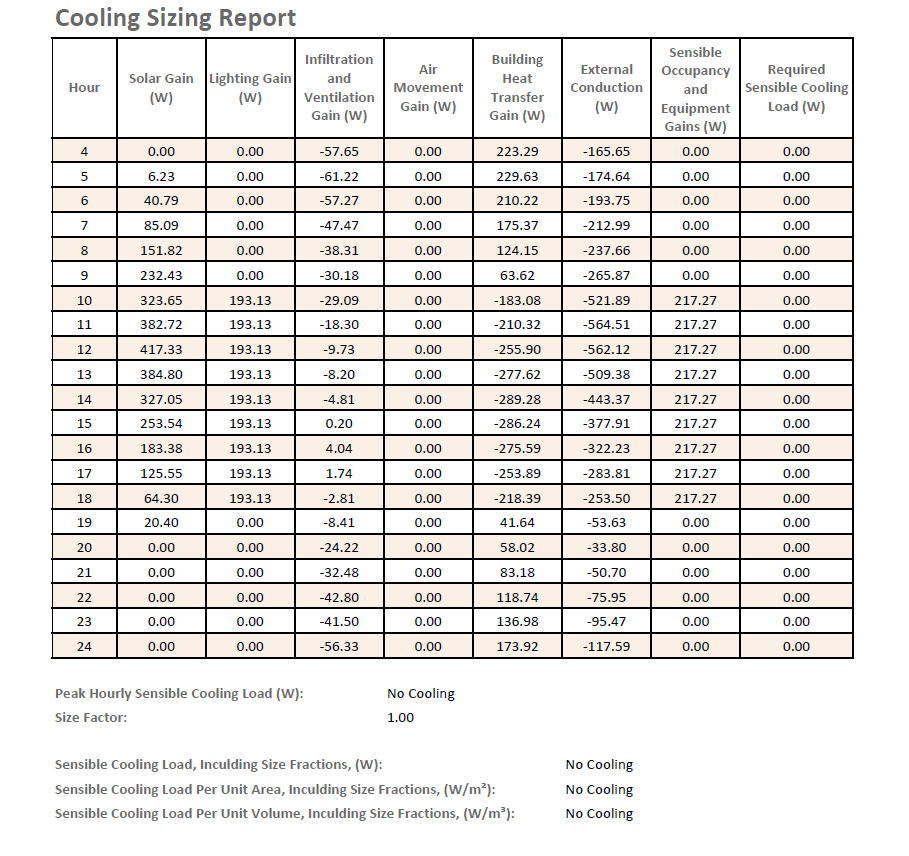
Figure 3.2.4: The second part of the Zone Breakdown section of the Cooling Sizing Report. Underneath the Sensible Energy Breakdown table, the required sensible cooling load is reported, along with the size factor. Finally the sensible cooling load, including the size fraction is reported.
-
Building Summary –
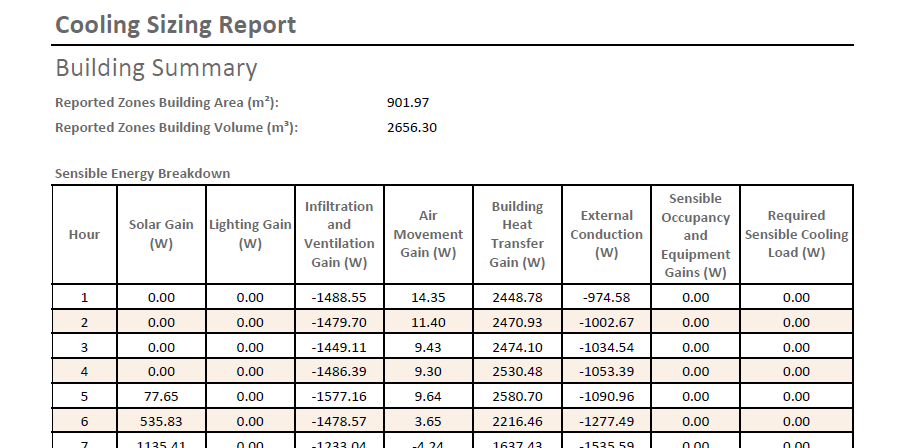
Figure 3.2.5: The Building Summary section of the Cooling Sizing Report. The Building Summary section provides a breakdown of the cooling loads for the building. At the top of this section, the area and volume of all reported zones in the model is displayed. Then the sensible energy breakdown for the building as a whole is displayed. Underneath the table, the sum of the peak zone cooling load, including size fractions, is reported for the building as a whole. Please note that even if the size fraction for every zone is equal to 1, the sum of the peak zone cooling loads will be greater than or equal to the peak sensible cooling load from the sensible energy breakdown table. This is because zones may have their cooling load peak in different hours.
-
Zone by Zone Breakdown Table –
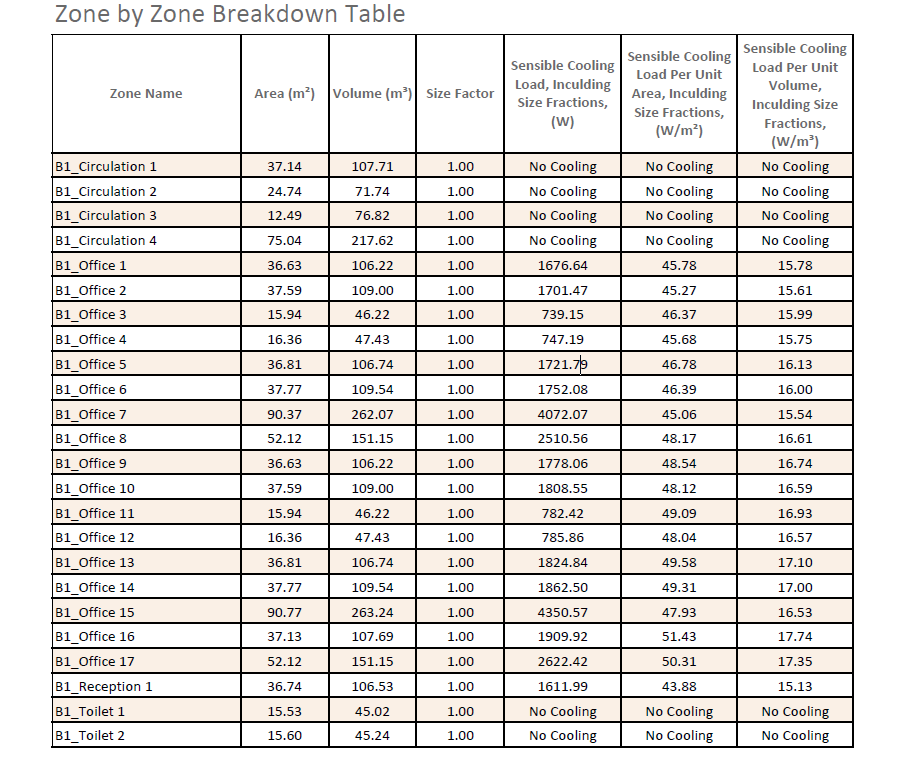
Figure 3.2.6: The Zone by Zone Breakdown Table on the Cooling Sizing Report. The zone by zone breakdown table just summaries the: area, volume and sensible cooling loads (including per unit area and per unit volume) for each zone in the model.